Bruker AC200-33 Statistics

| ||
| Statistics start date: | 5 January 1998 | |
| Date of last record: | 11 June 2019 | |
| Spectra registered in 2026: | 0 | |
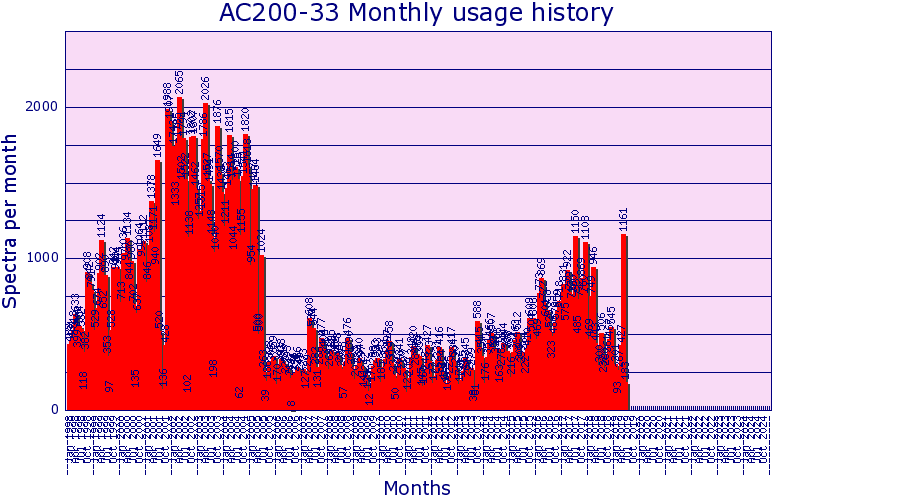
| Total spectra in 1998 - 2026: | 156832 | |
| 2D Spectra in 1998 - 2026: | 0 | |
| 3D Spectra in 1998 - 2026: | 0 | |
| Maximum spectra per day: | 231 (16 July 2017) | |
| Maximum spectra per week: | 546 (week start 10 Jul 2017) | |
| Maximum spectra per month: | 2065 (Apr 2002) | |
| Maximum spectra per year: | 18055 (2002) |