Bruker DRX-500 Statistics

| ||
| Statistics start date: | 14 October 1999 | |
| Date of last record: | 18 June 2026 | |
| Spectra registered in 2026: | 1287 | |
| Total spectra in 1999 - 2026: | 450260 | |
| 2D Spectra in 1999 - 2026: | 21877 | |
| 3D Spectra in 1999 - 2026: | 346 | |
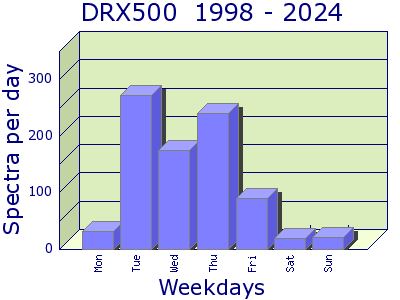
| Maximum spectra per day: | 1004 (30 April 2002) | |
| Maximum spectra per week: | 2469 (week start 23 Dec 2002) | |
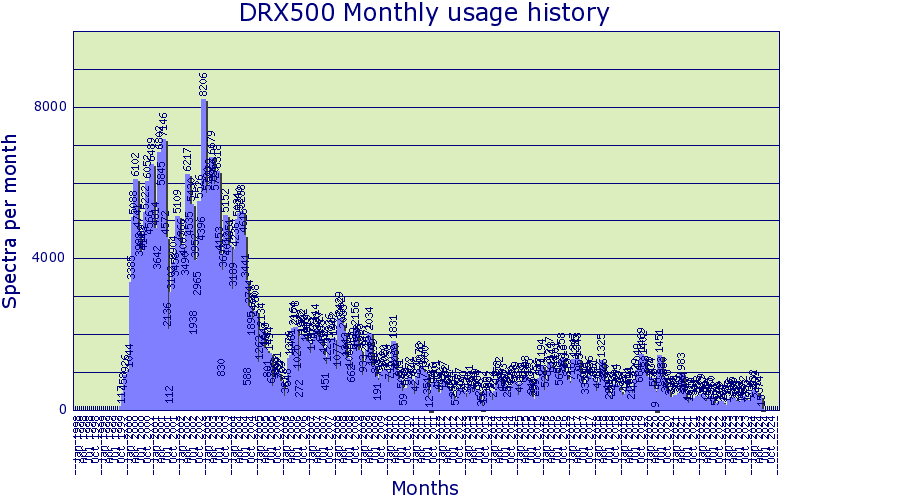
| Maximum spectra per month: | 8206 (Dec 2002) | |
| Maximum spectra per year: | 58533 (2003) |